

The monitoring
In order to deliver day after day services to its users, the ReCaS-Bari Data Center relays on several components , each one with its own critical issue.
Each of these components generates a considerable amount of information, fundamental for the good operation of the data center, and, accordingly, an amount of data not negligible in terms of disk space required for its storing. The collection of this large amount of data, however, would be quite useless if it was not accompanied by a simple and intuitive way to present the collected information; i.e. to ensure that the message contained reaches promptly and effectively the mangers as well as the users of the infrastructure.
For this purpose the tools provided by grafana.org were chosen to display the monitoring data of the ReCaS-Bari data center. With Grafana it is possible to create custom dashboards, with or without authentication, to show the metrics that are most effective.
The activity of the ReCaS-Bari data center can be monitored through the link: link:https://grafana.recas.ba.infn.it:3000/d/000000016/recas-bari
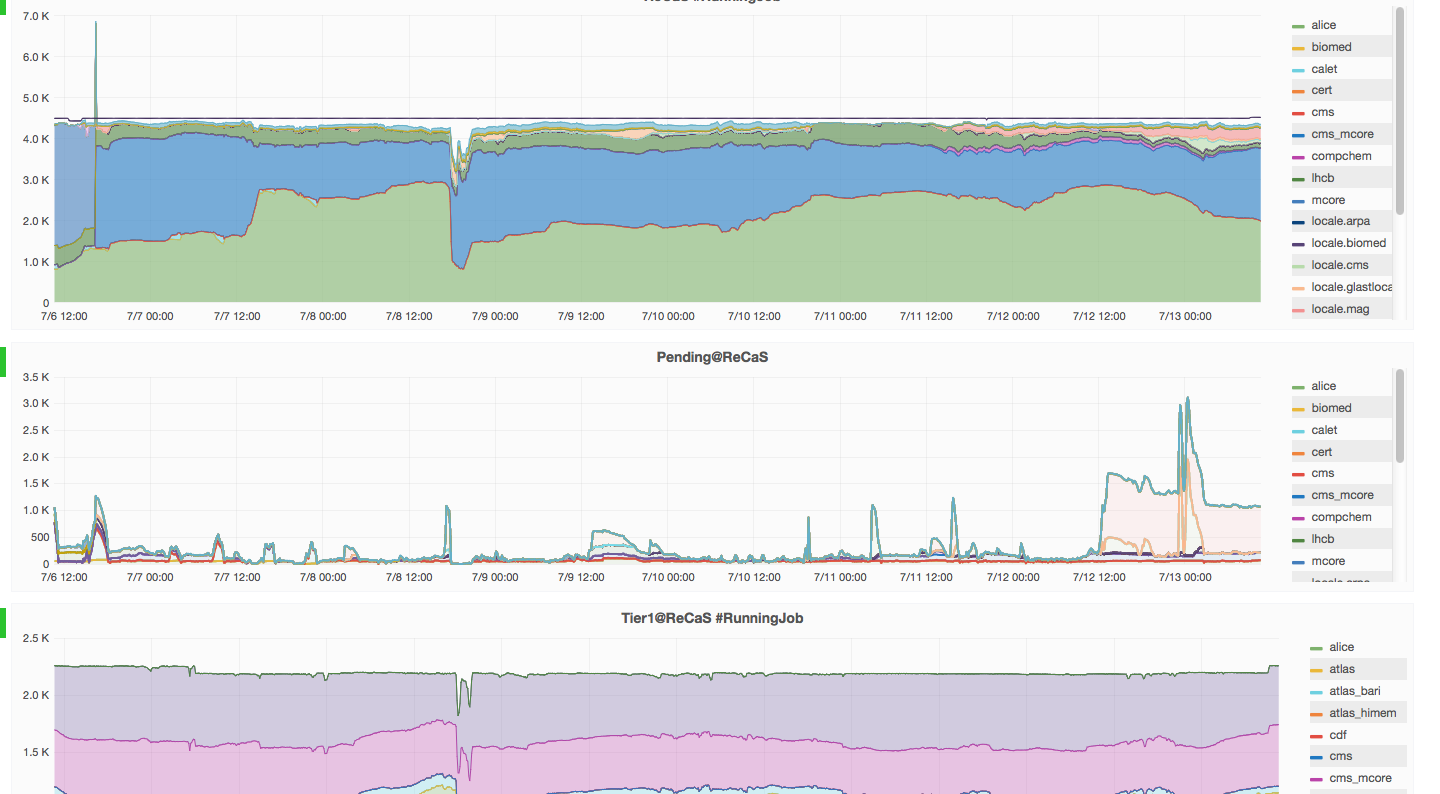
Selecting this link a "dashboard" with three bands will be presented:
The first band shows the slots (CPU_cores) occupied. The highest continuous dark line in the graph, called "cores", shows the number of slots (CPU cores) available to the HTCondor batch system as a function of time (note that this line has very little variation with time). The colored bands instead give an indication of the slot used from each of the Virtual Organization, VO, running on the Batch system HTCondor. Selecting a particular VO from the list on the right, one can focalize on the data relevant to that particular VO. By default, information about the last week are shown ( "Last 7 days"). By clicking on the "Last 7 days" link, top right, one can select a different Time interval.
The second band shows the number of jobs that are waiting to be executed on the batch system HTCondor for each VO and as a function of time.
Finally, since some of the ReCaS-Bari resources are remotely used from INFN Tier1 located in Bologna and managed by the CNAF, in the last band it is possible to see how these slots are used.
Following the link: https://grafana.recas.ba.infn.it:3000/d/000000020/accounting-htcondor-recas-donut
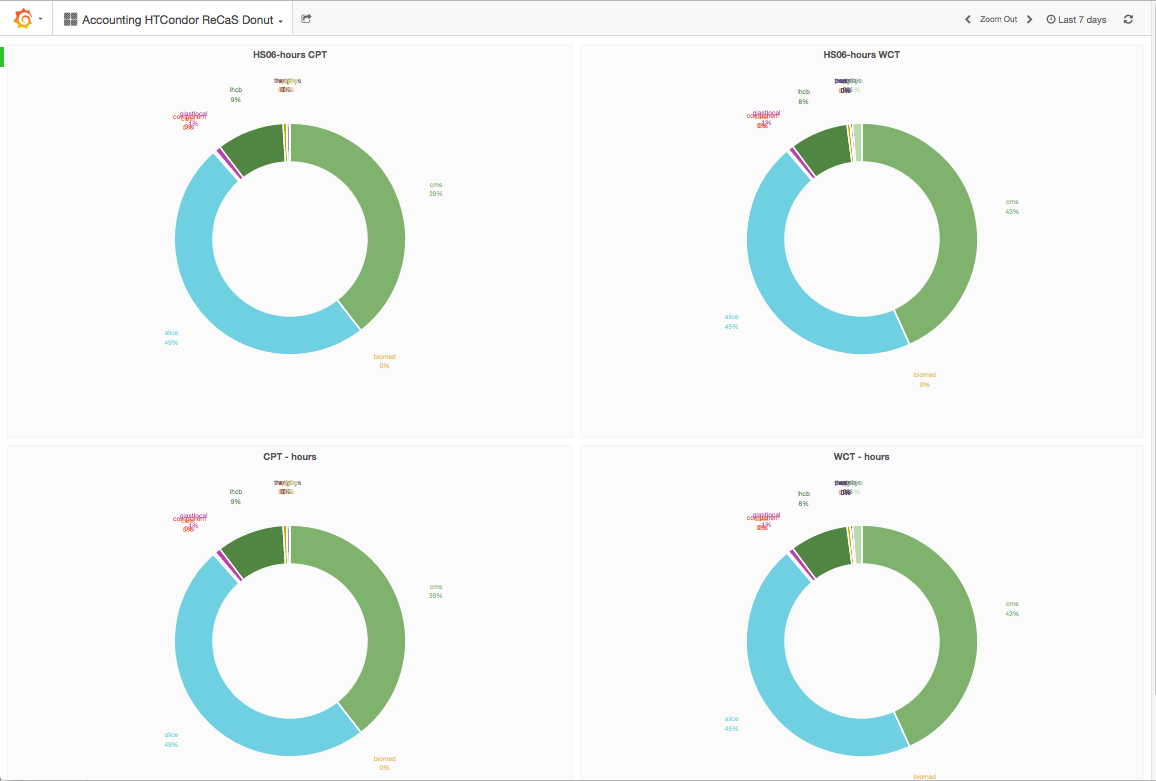
one gets to a page that presents the breakdown between the various VO (by means of donuts graph) of the use of the ReCaS- Bari Data center resources during the last week. Of course the time interval can be selected by the user by clicking on the "Last 7 days" link in the upper right corner of the window.
The data are shown in two different ways: the Wall Time (occupation time of the resource) and CPU Time (the effective use of resources purged by the waiting time for the retrieval of the data from the storage).
The use of the resources is shown both in units of "core_hours" as well as in unit of HS06_hours (typically a ReCaS-Bari CPU core has a computing power of about 10 HS06).
Finally following the link:
https://grafana.recas.ba.infn.it:3000/d/000000019/accounting-htcondor-recas?orgId=2
one gets to a page that has four bands.
The first band is a "stacked histogram", showing the total number of "HSE06 * day" used each day, highlighting the contribution of each VO to total consumption. The HSE06 is a measure of computational power. The use of a core of ReCaS-Bari for a whole day corresponds to a consumption of about 10 "HS06*day".
The second band shows, day by day, the number of total job submitted and the way they were submitted:
- from the grid: EC-01, EC-02, EC-03
- using a local submission tools: Ettore
By default the number of jobs shown is the total for all the VO (VO = All). But it is possible to select in multiple-choice menu, called "VO", in the upper left corner of the page, one or more VO. In this case the number of jobs shown in this histogram will be the sum of the number of jobs submitted by the selected VO.
The selection of VO applies not only to this histogram but also to those of the third and fourth band.
The third band shows the total daily consumption of computing resources. When all VO are selected (VO = All) this histogram is completely equivalent to the one shown in the first band apart from the details on the contribution of each VO. If, however, through the VO menu, top left, one selects a particular VO, the histogram shows the daily consumption of computing resources of that single particular VO.
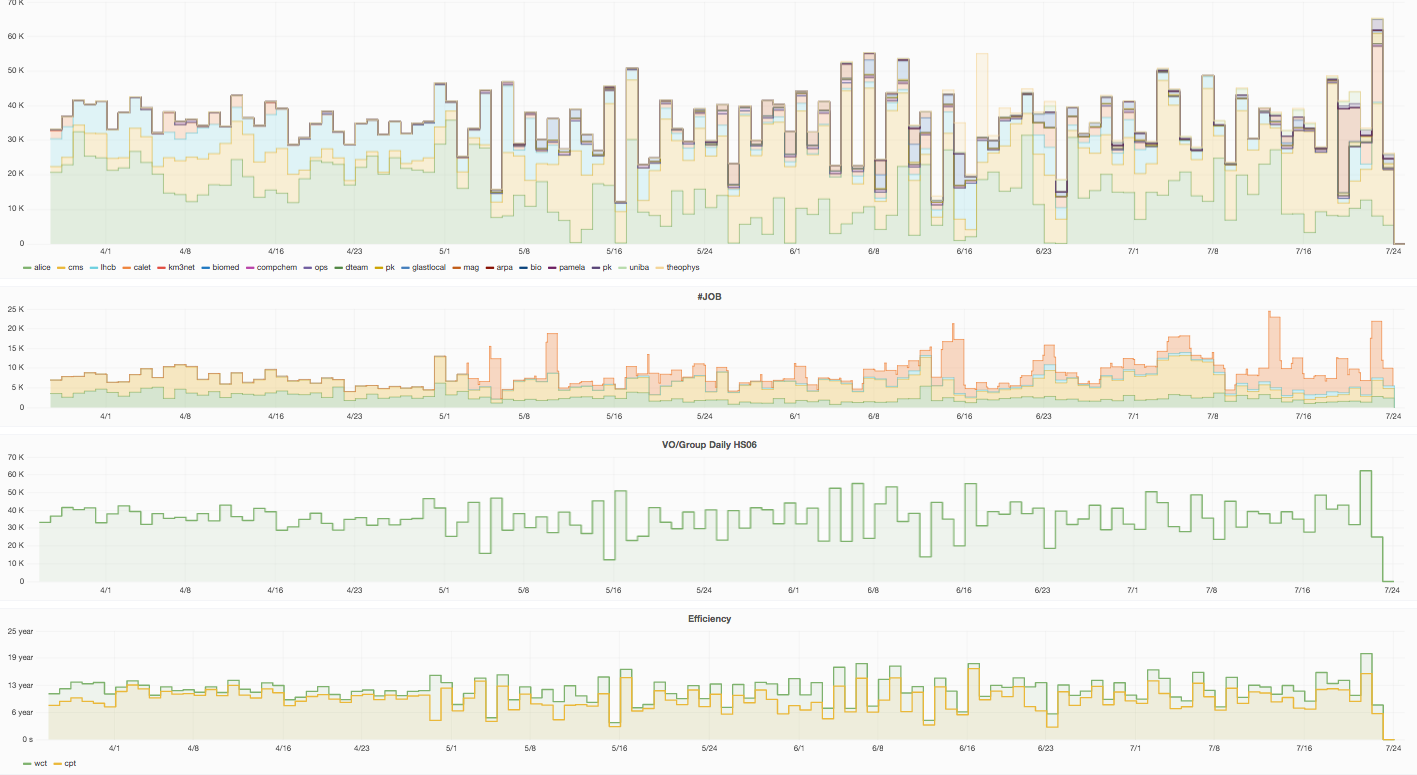
Particularly significant are the two histogram shown in the last band. They in fact refers to the CPU Time, the time during which the CPU was really used (doing something). superimposed to the Wall Time, the whole time during which the CPU was simply occupied. This time is always greater than the CPU Time because the Wall Time contains the waiting time for retrieving the data from the storage. In fact, one sees from the histogram that the Wall Time dominates in all the bins the CPU Time.
The smaller is the difference between these two histograms, the lesser is the CPU waiting time, or the faster is the reading of data from the storage. These two histograms thus give a visual indication of how efficiently the different applications use the infrastructure. By default are shown the Wall Time and CPU Time of all VO, but as mentioned before, by selecting through the multiple choice menu, the VO's of interest one can narrow down the comparison to the selected VO.